
PRESSURE MEASUREMENT: Characteristics, Technologies and Trends

Introduction
Pressure measurement and control is the most used process variable in the process control industry many segments. In addition, through the pressure it is possible infer a series of other process variables, like level, volume, flow and density. This article will cover the main technologies of the most important technologies used in pressure sensors, as well as some details concerning pressure transmitter installations, market and trends.
Pressure Measurement and a Bit of History
For many years pressure measurement has attracted the interest of science. At the end of the XVI century, the Italian Galileo Galilei (1564-1642) was granted the patent for a water pump system used on irrigation. (As a curiosity: in 1592, using simply a test tube and a water basin, Galileo assembled the first thermometer. The tube was turned upside down and half immersed in the water, so, when the air inside the tube cooled, the volume decreased and the water raised. When the air warmed, the volume raised and the water was forced out. Therefore, the water level measured the air temperature.) The core of its pump was a suction system that could raise the water at a maximum of 10 meters. He never knew the reason for this limit, which motivated other scientists to study this phenomenon.
In 1643, the Italian physicist Evangelista Torricelli (1608-1647) invented the barometer, with which he could evaluate the atmospheric pressure, i.e., the force of the air over the earth surface. He performed an experiment by filling a 1 meter tube with mercury, sealed at one end and immersed in a tub with mercury at the other. The mercury column invariably immersed in the tube approximately 760 mm. Without knowing exactly the reason for this phenomenon, he attributed it to a force produced at the earth surface. Torricelli also concluded that the space left by the mercury at the beginning of the tube was empty and named it “vacuum”.
Five years later, French physicist Blaise Pascal used the barometer to show that the air pressure was smaller at the top of the mountains.
In 1650, German physicist Otto Von Guericke developed the first efficient air pump, with which Robert Boyle carried out compression and decompression tests and 200 years later French physicist and chemist Joseph Louis Gay-Lussac, determined that the pressure of a gas confined at a constant volume is proportional to its temperature.
In 1849, Eugène Bourdon was granted the Bourdon Tube patent, used until today in relative pressure measurements. In 1893, E.H. Amagat used the dead-weight piston on pressure measurements.
.jpg)
Figure 1 – Bourdon Tube
In the past few decades, with the advent of the digital technology, an enormous variety of equipment spread through the market in multiple applications. The pressure characterization was really valued from the moment it was translated in measurable values.
The entire pressure measurement system is constituted by a primary element, which will be in direct or indirect contact with the process where the pressure changes occur, and a secondary element (the pressure transmitter) whose task will be translating the change in measurable values for use in indication, monitoring and control.
.jpg)
Figure 2 – The men who made pressure measurement history
Pressure Measurement Basic Principles
Let´s see the Static Pressure concept, taking as basis figure 3. It shows a recipient with a liquid that exerts pressure at a point that is proportional to the liquid weight and to the distance from the point to the surface. (The Archimedes principle: a body immersed in a liquid is subject to a force, known as thrust, equal to the weight of the displaced liquid. For example, this principle makes if possible to determine the level, by using a floater subject to the thrust of a liquid level that is transmitted for an indicator of the movement, whose level is being measured, since the thrust varies with the density).
Static pressure P is defined as the ratio between force F applied perpendicularly to a surface with area A: P = F/A [N/ m2).
.jpg)
Figure 3 – Pressure on an immersed point P
.jpg)
Figure 4 – Pressure on an immersed body
Figure 4 shows a parallelepiped with a side A and length L area on one side, where the pressure on its upper face and its lower face are given respectively by PD = hpg and PU = (h + L) pg. The resulting pressure is equal to PU - PD = lpg. The pressure employed by a force perpendicular to the fluid surface is called static pressure. The Pascal principle states that any increase on the liquid pressure will be transmitted equally to all points on the liquid. This principle is used on hydraulic systems (like car brakes) and can be illustrated by figure 5. In other words: the applied forces have intensities proportional to the respective areas.
Also, is worth quoting Staven Law (1548-1620): on a homogeneous and uncompressible fluid on equilibrium under the action of gravity, the pressure grows linearly with the depth; the difference of pressure between two points is equal to the product of the fluid specific weight by the difference of level between the points under consideration.
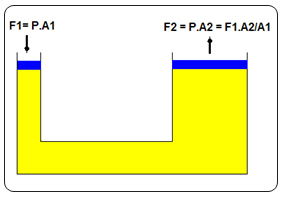
Figure 5 – The pressure is perpendicular to the surface and the forces applied have intensities proportional to the respective areas
Observe now the pressure applied by the moving fluids on a tube transversal section. Let´s take figure 6, where:
F1 = force applied to surface A1;
P1 = ratio between F1 e A1;
ΔL2 = distance displaced by the fluid;
V2 = speed of displacement;
h2 = heigh relative to the gravitacional reference.
and
F2 = the force applied to surface A1;
P2 = ratio between F1 e A1;
ΔL2 = distance displaced by the fluid;
V2 = speed of displacement;
h2 = height relative to the gravitational reference.
.jpg)
Figure 6 – Bernoulli equation – The pressure applied by the moving fluids on the tube transversal section.
Supposing an ideal fluid without viscosity, it is displaced with friction and so without energy loss.
The work carried out by the resultant of the forces acting on a system is equal to the variation of the kinetic energy, the work-energy theorem. With this, we have:
P1+ (1/2) ρ .v12 + ρ . g . h1 = P2 + (1/2)ρ . v22 + ρ . g . h2
This is the Bernoulli equation that proves that the pressures total along a tube is always constant on an ideal system. The interesting thing on this equation is that the following pressures can be recognized:
- P1= Applied Pressure
- (1/2) ρ.v12 = Dynamic Pressure
- ρ.g. h1 = Static Pressure
Rearranging this ratio we arrive at the equation:
.jpg)
This ratio is very useful to calculate de fluid speed, given the impact pressure and the static pressure. From this ration, there may be calculated, for example, the fluid flow:
.jpg)
The C values are experimental results and for each type of primary measurement element and impulse-take system, C varies in function of the piping diameter (D), the number of Reynolds (Rd) and the ratio of the diameters related to section A1 and A2 (.jpg) )
)
C = f(D,Rd,β)
Pressure Units on the International System (SI)
The Pascal [Pa] is the pressure unit on the International System of units (SI).
One Pa is the pressure generated by the force of 1 Newton over a surface of 1 square meter atPa = N/m2.
Table 1 shows the principal units and the conversion between them.
|
|
inH2O @20oC |
atm |
bar |
kPa |
kgf/cm2 |
mmH2O @20oC |
mmHg @0oC |
inHg @32oF |
psi |
|
inH2O @20oC |
1 |
0,0025 |
0,00249 |
0,24864 |
0,00254 |
25,4000 |
1,86497 |
0,07342 |
0,03606 |
|
atm |
407,513 |
1 |
1,01325 |
101,325 |
1,03323 |
10350,8 |
759,999 |
29,9213 |
14,6959 |
|
bar |
402,185 |
0,98692 |
1 |
100,000 |
1,01972 |
10215,5 |
750,062 |
29,5300 |
14,5038 |
|
kPa |
4,02185 |
0,00987 |
0,01000 |
1 |
0,01020 |
102,155 |
7,50062 |
0,29530 |
0,14504 |
|
kgf/cm2 |
394,407 |
0,96784 |
0,98066 |
98,0662 |
1 |
10017,9 |
735,558 |
28,9590 |
14,2233 |
|
mmH2O @20oC |
0,03937 |
0,00010 |
0,00010 |
0,00979 |
0,00010 |
1 |
0,07342 |
0,00289 |
0,00142 |
|
mmHg @0oC |
0,53620 |
0,00132 |
0,00133 |
0,13332 |
0,00136 |
13,6195 |
1 |
0,03937 |
0,01934 |
|
inHg @ 32oF |
13,6195 |
0,03342 |
0,03386 |
3,38638 |
0,03453 |
345,935 |
25,4000 |
1 |
0,49115 |
|
psi |
27,7296 |
0,06805 |
0,06895 |
6,89475 |
0,07031 |
704,333 |
51,7149 |
2,03602 |
1 |
In function of the reference, the pressure measurement can be classified as: gauge, absolute and differential or relative. Let´s take figure 7 as reference:
.jpg)
Figure 7 – References for Pressure and most usual Pressure types
- Absolute pressure: it is measured with relation to perfect vacuum, namely, the pressure difference at a given measurement point by the vacuum pressure (absolute zero). Normally the ABS notation is used when this greatness is indicated. Example: The absolute pressure applied by the atmosphere at sea level is 760mmHg.
- Differential pressure:it is the pressure difference measured between two points. When any point other than vacuum or atmosphere is used as reference it means differential pressure. For example, the differential pressure found on an orifice plate.
- Gauge pressure:it is measured in relation to the ambient pressure, namely, in relation to the atmosphere. It is always important to register on the notation that it is a relative measurement. Example: 10Kgf/cm2 Relative Pressure.
Note that the gauge pressure is given by the difference between the absolute and the atmospheric pressure.
Sensors used on Pressure Measurement
Generally, sensors are classified according to the technique used on the mechanical pressure over a proportional electronic signal. All techniques have a single purpose: turningthe pressure applied on a sensor into an electronic signal proportional to it:
- Variable Capacitance (Capacitive)
- Piezo-resistive (Strain Gauge)
- Potentiometric
- Piezo-electric
- Variable Reluctance
- Resonant
- Optical
- Others
1) Piezo-resistive or Strain Gauge
Piezo-resistivity refers to the alteration of the electric resistance with the deformation/contraction as a result of the applied pressure. They are mostly formed by crystal elements (strain gauge) interconnected in bridge (wheatstone) with other resistors that provide zero adjustment, sensitivity and temperature compensation. The construction material varies according to the manufacturer and today solid state sensors are easy to find.
Disadvantages: limited operation temperature range, applicable on low pressure ranges because they generate a very low, unstable, excitation signal.
Currently there is the so-called film transducer , which is made from steam deposition or the injection of strain-gauge elements directly on a diaphragm, minimizing the instability due to the use of adhesives on the alloy of bonded wire models. The great edge is that it produces a higher level electric signal, however totally vulnerable at high temperatures, because the temperature affects the adhesive material used when sticking the silicon to the diaphragm.
Several techniques based on the production of piezoresistive silicon sensors (silicon substrate) are emerging, however susceptible to signal degradation in function of the temperature and require compensation from complicated circuits, error minimization and zero sensitivity. They are totally unviable in applications subject to long high temperature periods, as the diffusion degrades the substrates in these conditions.
.jpg)
Figure 8 – Piezo-Resistive Sensor
2) Piezo-electric
The piezo-electric material is a crystal that produces a differential tension proportional to the pressure applied on its faces: quartz, Rochelle salt, barium titanium, tourmaline, etc. This material cumulates electric loads in certain areas of its crystal structure, when they suffer physical deformation by the action of a pressure. The piezo-electricity was discovered by Pierre and Jacques Curie in 1880.
Their disadvantage is that they require a high impedance circuit and a high gain amplifier and are susceptible to noises. Furthermore, due to their dynamic nature they do not perform solid state pressure measurement. However, their advantage is a quick response.
The relation between electric load and the pressure applied to the crystal is practically linear:
q = Sq x Ap
p – applied pressure, A - electrode area, Sq - sensitivity,
q - electric load, C – crystal capacity, Vo –voltage output
.jpg)
Figure 9a – Piezoelectric Sensor
.jpg)
Figure 9b – Piezoelectric Sensor
3) Resonant
They generally follow the technology principle known as vibrating wire. A magnetic wire coil is attached to the diaphragm, which oscillates when subject to a magnetic field that will conduct an electric current. The oscillation frequency is proportional to the wire voltage square root (expansion/compression). The Resonant Silicon sensor does not employ a wire but the silicon to resonate with different expansion/resonance frequencies (a 1/f2 function). The sensor is formed by a silicon capsule set on a diaphragm that vibrates when a pressure differential is applied and the vibration frequency depends on the applied pressure. Some resonant sensors require temperature compensation techniques via complicated hardware/software temperatures, by increasing the number of components, which need more electronic plates in some equipment.
4) Capacitive
These sensors are the most reliable and have been used on million of applications. They are based on transducers whose pressure applied to diaphragm sensors produces a variation of capacitance between them and a central diaphragm, for instance. This variation is typically used to vary an oscillator frequency, used as a capacitor bridge element and also to vary an oscillator frequency. This frequency can be measured directly by the CPU and converted into Pressure. In this case there is no A/D conversion and contributes to the exactness and elimination of drifts encountered on analog/digital conversions. It is worth remembering that this reading principle is totally digital and is used by Smar since the middle 80s. Smar is the only Brazilian company and one of the few in the world to make this type of sensor. They have linear and practically insensitive to temperature variations, being the favorite for instrumentation and process control, as they have excellent performance on stability, temperature and static pressure. Some of their best features:
- Ideal for low and high pressure applications.
- Minimize the Probable Total Error and consequently process variability.
- Ideal for flow applications.
- Their lineal response allows high rangeability exactness.
.jpg)
Figure 10 – Example of a capacitive sensor construction.
5) Optical – They are still not well known, but below are some milestones of fiber optics evolution:
- It was invented by the Indian physicist Narinder Singh Kanpany.
- 1970: Corning Glass produced a few optical fiber meters with losses of 20 db/km.
- 1973: An optical fiber circuit was installed in the United States.
- 1976: Bell Laboratories installed a telephone link of 1 km in Atlanta, GA, and proved to be practically feasible its use for telephone communication.
- 1978: The production of optical fibers began in several world locations with losses below 1,5 dB/km.
- 1988: The first optical fiber submarine cable immersed in the ocean and gave birth to the information super highway.
- 2004: Optical fibers account for 40 billion dollars annually.
- 2007: Brazilian optical fiber turned 30 years and the all-American optical fiber market billed 237 million dollars.
- 2014: The American market of optical fiber sensors has an estimate of 237 million dollar billings.
The sensitivity of fiber sensors, namely, the less intense measurable disturbance, may depend on:
- Infinitesimal variations on some parameter of characterizing the used fiber, when the fiber is the very sensor element;
Optical fiber sensors are compact and show sensitivity comparable to similar conventional devices. Pressure sensors are built using a moving membrane on one of the fiber ends. The advantages of these sensors are: high sensitivity, small size, flexibility and resistance, low weight, long life span, long transmission distance, low material chemical reactivity, ideal to operate on intrinsically safe, high voltage and hazardous ambient , electric isolation, electromagnetic immunity, multiplexing of signals, i.e., a single fiber can have dozens of sensors to measure vibration, pressure, temperature, multiphase flow, deformation, etc.
A technique used on optical sensor construction is the Fabry-Perot Interferometer, a device generally utilized to measure high precision wave lengths, whose two partially reflecting mirrors (of glass or quartz) are aligned and provide a maximum fringe contrast and the distance between them through mechanical variation. The distance variation could be generated by pressure and it would work as a pressure sensor.
Fabry-Perot cavity length Stainless steel diaphragm Feed-through connector Optical Fiber Cable
.jpg)
Figure 11 – Pressure Sensor with the Fabry-Perot principle.
Industrial Equipment for Pressure Measurement
In the industry, among several equipment used for pressure measurement two of them can be enhanced: the manometer and the pressure transmitter.
The gauge meter is used for local pressure reading and normally has a connection to the process and a display (when electronic) or a pointer (when mechanical) for local pressure reading. They are usually inexpensive devices to be used when the pressure does not have to be transmitted to a control system and no exactness is required. For example, static pressures, pump pressures, etc. There are also differential, sanitary models, vacuometers, etc.
.jpg)
Figure 12 – Types of manometers.
An intelligent pressure transmitter combines the sensor technology and its electronic.
Typically, it must provide the following characteristics:
- Digital output signal;
- Digital communication interface (HART/4-20mA, Foundation Fieldbus, Profibus-PA);
- Pressure and temperature compensation;
- Stability;
- Easy calibration;
- Re-range (with or without reference);
- Self Diagnostics;
- Easy installation and calibration;
- High reliability;
- Low costs and short installation and maintenance periods;
- Reduction on the pressure intrusion/penetration;
- Space saving in installation;
- Allow upgrades to Foundation Fieldbus and Profibus PA technologies;
- EDDL and FDT/DTM interface resources;
- Transient protection, without power supply polarity;
- Physical locking for custody transference, etc.
Users must be cautious about some points to avoid paying higher prices for something they will not use or is not required by their application:
- Exactness & Rangeability:if they really need equipment with these features, analyze the exactness formulas and note that sometimes exactness is not announced on all ranges. Watch also other characteristics like response time, totals, PID block, etc. as they are likely to be more useful on their applications.
- Protection to the investment: analyze the cost of spare parts, the interchangeability between models, simplicity of specification, upgrade to other technologies (Foundation Fieldbus, Profibus PA), technical services, technical support, reposition term, etc. These are factors that may impair the plant availability.
Electronic Diagram
.png)
Figure 13 – LD400 - HART 4-20mA Pressure Transmitter with capacitive sensor, single electronic plate, high performance (the transmitter with the best response time in the market)
The microprocessed pressure transmitters have the great advantage of allowing better interaction with the user, with friendly interfaces. Furthermore, their self-diagnostics features help identifying problems. The advent of fieldbus networks made it possible to extract the maximum possible problems identification. These transmitters have more exactness, electronic stability superior to analogical models, in addition to making adjustments and calibrations easier. Digital technology also enables the implementation of powerful algorithms to improve the performance and exactness of the measurement and the on-line monitoring of the equipment life.
Example of Typical Pressure Transmitters Applications
Below are examples of pressure transmitter applications. For more details about each of them consult the literature available on the article references. Remember that the correct installation ensures the best performance of the equipment.
- Liquid level measurement
.jpg)
Figure 14 – Open tank level measurement
Open tank
PL = Patm (atmospheric pressure)
PH = Patm + h. p. g
DP= PH - PL = n. p. g = K. h
- TRM low side is open for atmospheric pressure.
- Only for liquids.

Figure 15 – Closed tank level measurement
Closed tank
PL = Ptop (steam pressure)
PH = Ptop + h . pg
DP= PH - PL = h. p. g = K. h
- TRM Low side connected to the tank upper part
- Only for liquids.
- Flow measurement
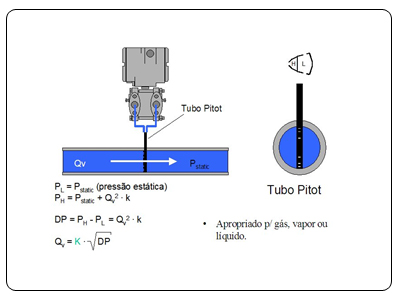
Figure 16 –Pitot tube flow measurement
Pitot Tube
PL = Pstatic (static pressure)
PH = Pstatic + Qv2 . k
DP= PH - PL =Qv2 . k
Qv =K. √ DP
- Appropriate for gas, steam or liquid.
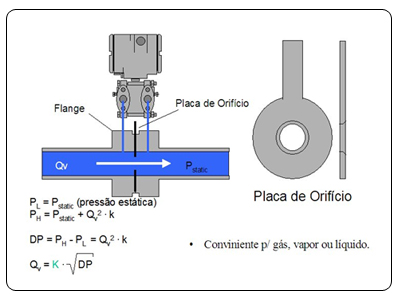
Figure 17 – Orifice plate flow measurement.
Flange Orifice Plate
Orifice Plate
PL = Pstatic (static pressure)
PH = Pstatic + Qv2 . k
DP= PH - PL =Qv2 . k
Qv = K. √ DP
- Convenient for gas, steam or liquid.
-
Volume and mass measurement
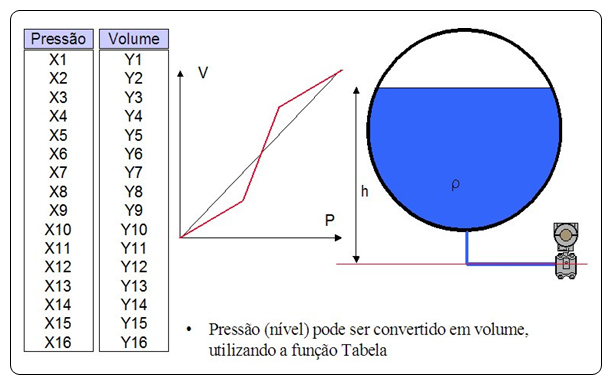
Figure 18 – Volume measurement.
-
Level pressure can be converted to mass, using the Table function.
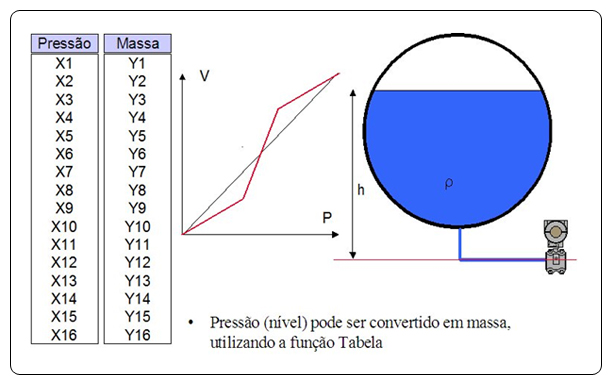
Figure 19 – Mass measurement
Important Accessories for Pressure Measurement and their Variants
Due to the great number of possible applications, some accessories must be available when using pressure transmitters. The most common ones are the manifolds and remote seals, as shown on figure 20 below. The remote seals are used to transmit the pressure to a point distant from the sensor or even ensure the right conditions for the measurement on process temperature cases. The manifolds are small valves used to help performing equipment, calibration and maintenance operations.
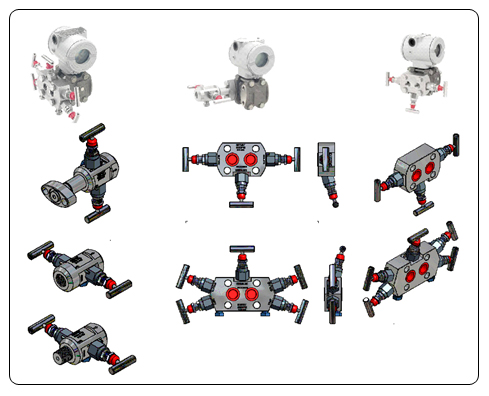
Figure 20 – Accessories for several transmitter applications.
How to Specify Pressure Transmitters
The use of incomplete specifications or inconsistent data is quite common in the documentation to acquire pressure transmitters. At a first glance, they look like simple project items, but many are the details that, if not correctly specified, are liable to result in losses during mounting or even during the operation and the harm can be bigger than the values of the equipment involved.
This topic seeks to clarify some fundamental questions on the process of specifying pressure transmitters.
What to measure?
Manometric pressure, absolute pressure, differential pressure, other greatnesses inferred from measurement, like flow, level, volume, force, density pressure, etc.
Note that pressure measurements lower than atmospheric pressure do not necessarily require absolute pressure transmitters. Absolute pressure transmitters are recommended only to prevent the influence of atmospheric pressure variations. This influence will be critical only when measuring very close pressures, over or under the atmospheric pressure. Anywhere else, manometric pressure transmitters can be used without problems.
Why measuring pressure?
Generally, pressure is measured for process monitoring or control; safety; quality control, fluid commercial transactions, like custody transference, fiscal measurement; studies and research; mass and energy balances.
These objectives must be considered when choosing the equipment. More rigorous questions on performance such as: exactness, overpressure and static pressure limits, stability etc., may increase the project costs unnecessarily. Practically all manufacturers offer more than one version of transmitters with different technical features and obviously with different prices.
Which is the process fluid?
The supplier must be informed about the fluid characteristics. In most cases, the manufacturer may recommend special materials or connections, but the final decision will always be up to the user or the hired engineering company. These are some fundamental process fluids for the right transmitter choice:
- State (liquid, gas, steam): defines the valve drain/vent position;
- Maximum process pressure: is important to evaluate the transmitter overpressure and static pressure limits;
- Maximum process temperature: may be determinant for using remote seals or simply to keep a minimum distance from the impulse line (tubing).
Optionals?
Some optional features can be included in the transmitter supply:
- Local indicator: this item is not too costly and is very useful, as it not only allows the reading of variables in engineering units (kgf/cm2, bar, mmH2O, Pa, psi, etc.) but also facilitates configuring the transmitter when a configurator is not available.
- Manifold: product bundling ( transmitter + manifold purchase) has commercial advantages and avoids technical incompatibilities on mounting.
- Support for 2” pipe: an almost compulsory item. Some supports also allow mounting on flat surfaces. At least stainless steel nuts and bolds should be specified, for better resistance to corrosive atmospheres.
- Cable clamps: this item can be ordered with the transmitter. However, it should be included on the mounting material, in order to ensure the compatibility with the gauge of the specified cable.
Communication protocol?
The most common communication protocols are: 4-20 mA + HART, Foundation Fieldbus and Profibus PA.
Some manufacturers market transmitters that change their protocol version by simply substituting the electronic circuit board or just the firmware to allow their use on different systems.
Also, they offer with the transmitters, CDs with all the archives (DDs and DTMs) that ensure communication and interoperability edge with the several existing control systems.
Special tools?
Transmitters with Foundation Fieldbus or Profibus PA protocols do not require portable configurators, since the network configuration tools installed on supervising computers or any engineering station is also capable of accessing and configuring the devices. For conventional projects (4-2-mA + HART), it is recommended the acquisition of hand-held configurators. In some transmitters, the configuration can be done directly on the devices, with the use of resources like the magnetic screwdriver or local buttons.
Pre-configuration?
On conventional transmitters it is possible to request to the maker, generally at no additional cost, some pre-configurations: square root extraction; calibrated range; display indication in engineering units and/or special units, for example: m3/h, l/h, m3. In this case, the unit and scale should be indicated previously.
Certifications?
It is common for the user to request to the manufacturer calibration certificates issued by metrology laboratory tracked by RBC. Standardized certificates are generated and issued during the device production stage. Other calibration certificates, when issued by RBC-tracked labs may require longer delivery terms and involve additional costs.
Another important certification must be observed when the transmitters are used in hazardous areas. The projects for these cases adopt regulations compliant to explosion proof, increased safety or intrinsic safety. The certificates are distinct ones and the user is responsible for its correct utilization. The same applies to SIS, Safety Instrumented Systems.
Special connections?
In applications with aggressive fluids, high temperature or viscosity, suspended solids, remote seal or integral transmitters are recommended. Integral seal transmitters are called level transmitters. Whenever possible, the use of seals must be avoided, as these degrade the measurement exactness, raise the transmitter response time and suffer great influence from the ambient temperature. Seals with flanged connections must be compatible with the process flanges and respect the pressure classes established on pressure tables and the temperature of the respective standards.
Pressure range / rangeability?
The manufacturers adopt a standardized terminology that must be known:
- URL: calibration range upper limit;
- LRL: calibration range lower limit, generally LRL = -URL;
- URV: calibration range upper value (should be smaller than or equal to the URL);
- LRV: calibration range lower value (should be higher than or equal to the LRL);
- SPAN: URV – LRV (should be higher than the device minimum SPAN).
The ratio URL / minimum SPAN defines the device rangeability.
The manufacturer catalogs generally show the URL, LRL and minimum SPAN for the several transmitter ranges. Note that the minimum SPAN for a certain range will be always higher than the URL of the immediately lower range. Example:
- Range 4 - URL: 25 kgf/cm2 ; minimum Span : 0,21 kgf/cm2; overpressure or static pressure limits: 160 kgf/cm2;
- Range 5 - URL : 250 kgf/cm2 ; minimum Span : 0,21 kgf/cm2; overpressure or static pressure limits: 320 kgf/cm2.
For a 0 to 20 kgf/cm2 calibrated range application it is possible to use range 4 or even range 5. However, the lower range should always be chosen. All specifications for stability, temperature effect, static pressure effect are determined with URL percent values. An exception for that choice is when the overpressure or static pressure can be reached. On the example above this limit is 160 kgf/cm2 for range 4 and 320 kgf/cm2 for range 5.
Functional resources
Some transmitters have very interesting functional resources. For Foundation Fieldbus protocol transmitters it is important to know the functional block library available. The user must be informed not only about the diversity of these blocks, but also about the marketing policy for these resources. Some makers supply the device with some basic blocks and charge extra price to include advance blocks. It is also important to be aware of the number of blocks that can be processed on a single transmitter. This limit can be critical in projects with more complex control loops.
For conventional 4-20 mA + HART transmitters the use of additional functionalities is also possible.
PID control
With this configuration the transmitter executes the PID algorithm, by comparing the process variable with a pre-adjusted set-point and generates the current output signal to be directly connected to the control valve positioner. This resource is valid for simple control loops that do not need operator intervention, always on automatic with constant set-point.
Flow totals
The differential pressure transmitter when used on flow measurement can be configured for local indication of the total flow, besides the instantaneous indication.
Conclusion
This article presented some highlights on the history of pressure measurement, its importance in automation and process control, peculiarity of some sensor types, combined with the pressure transmitter technological advancements. We also examined the care required in relation to transmitter installations and specification and market trends.
References
- Intech Edição 74 , Pressure Transmitters: sensors, trends, market and applications, César Cassiolato, 2005
- Controle&Instrumentação - Edição nº 106, Brazil breaking technological barriers with innovation – Pressure Transmitters César Cassiolato, 2005
- Controle&Instrumentação - Edição nº 113, Specifying Pressure Transmitters, César Cassiolato, Francisco Julião, 2006.
- Intech Edição 93 , Pressure Measurements: features and technologies, César Cassiolato, 2007
- Controle&Instrumentação - Edição nº 135, Pressure Measurements: Everything you need to know, César Cassiolato, 2008
- Controle&Instrumentação - Edição nº 137, Flow Measurement, César Cassiolato, Evaristo O. Alves, 2008
- Pressure Transmitter Operation and Training Manuals Smar: LD301, LD302, LD303 e LD400
- https://www.smar.com.br/en
Copyright Statement
All illustrations, trademarks and products mentioned in this article are the property of their respective owners, as well as any other form of intellectual property, being herewith used strictly in educational character.


